Building an application
Leveraging transactional data to help you improve your customer's experience is what we are about. This is where GorilaCORE comes in; our API enables you to quickly build and deliver a superior experience, reducing the time-to-market of development.
Below we'll explore the use case tailored to companies that seek to transform their client's transactional data into an investing experience.
🚀 Launch Faster
Save time and resources spent on modeling financial markets The variety of financial products available to the public is enormous and ever-growing. One of the most challenging problems to solve is to build and maintain a broad and well-modeled coverage of products.
Additionally, the knowledge to address a multitude of particular cases to accurately calculate a portfolio's performance based on raw transactional data is often underestimated, leading to frustration and increased lead time.
Our team is composed of seasoned financial markets professionals coupled with top-of-the-line engineers to help you avoid dealing with such complexities and focus on your client's experience. Helping you launch your product faster while delivering accuracy to your client is our mission.
🏗️ Build for scale
Processing portfolios at scale is a challenge. After years in the industry, we've reached a way to simultaneously allow you to audit the output of every calculation and, at the same time, provide data consistency and timely processing at scale.
When building a system that models financial complexity, imperfect transactional data (the industry is improving on that), multiple pricing data sources, and allows for the end user to have flexibility (like changing the past of its transactional data), being able to audit every step and every input that goes into reaching a portfolios key indicators is critical. Not only it allows quick troubleshooting, but the detection of which moving part needs to be corrected.
Gorila's experience as a player in the investment app space allowed us to perfect the various non-obvious needs of an API consumer. We also process more than one million portfolios daily and perfected our code and infrastructure to scale many orders of magnitude beyond that.
📱 Using GorilaCORE to build an investment app
Let's explore a practical case to build a simple investment app using our API. For a detailed (with code blocks) example, head to our Quick Start guide.
Create Organization
First of all, you need to register to use our API. Reach us through this contact form, and we'll help you get started quickly. You'll receive an API Key at the end of the process to effectively use our endpoints.
Create Portfolios for your clients
A Portfolio represents our API's fundamental entity; every client on your end will be represented as a portfolio.
So, to start things, you should create portfolios to represent your clients, and remember to map each created portfolioId to a client on your database so you can reference them later.
Insert transactional data
Now you can reference your clients by portfolioId. Which means you can start inserting their transactional information, then we can build their positions for you.
An usual challenge in this phase is to match your identifier for a security (or financial product) with our API.
We've created a few ways to address this issue. We understand that are many unique identifiers throughout the industry (Ticker/Symbol, ISIN, CNPJ for funds, etc.), and we want to make it as easy as possible for you to get started quickly and avoid mapping all your securities IDs with ours.
For that reason, we've built a powerful securities search engine to help you find what you need. Additionally, you can use filters to match known finance identifiers directly.
With that in mind, it's time to insert transactions into your client's portfolio. For that, you'll need a valid identifier of the security that was transactioned, details of the transactions (price, quantity, side, etc.), and the portfolioId it refers to.
Build a dazzling experience
After inserting your clients' transactions, you can access various information about their portfolios.
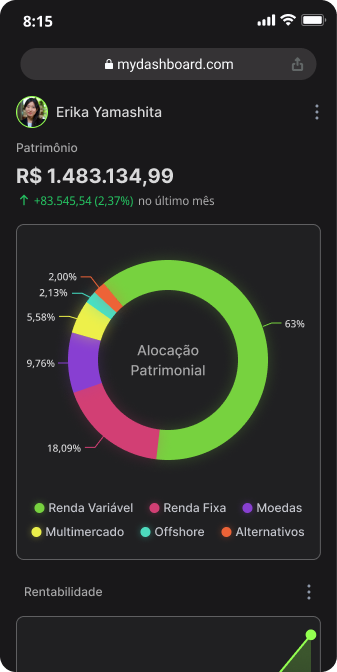
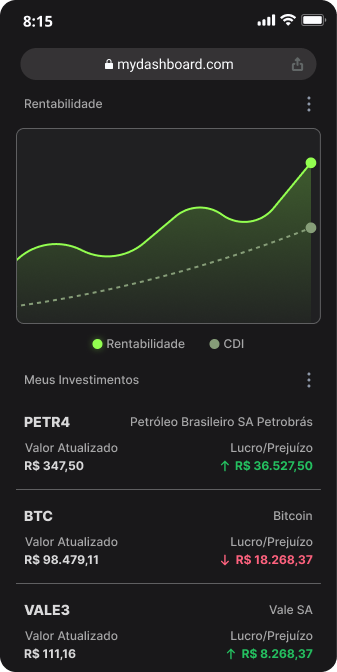
Following the mockup shown below, let's explore a portfolio to build the intended experience.


Summarized investment data (NAV, P&L, Performance)
The first component shows the investor's summarized key indicators: the portfolio's NAV, its Profits and Losses, and Time Weighted Return since inception. We need to access the corresponding endpoints and query the required values. Remember to set INTERVAL in the frequency parameter to return a single value corresponding to the entire query period.
Asset class distribution
We'll now use the market value endpoint to build two components. First, we'll request all our positions' market value and save the returning output.
Now, we'll have to understand which asset class each security belongs to. For that, we'll need to loop each security belonging to the portfolio, request more details in the securities information endpoint, and enrich our list.
Finally, it's a matter of grouping and adding up positions from the same asset class. The Market Value resulting from the sum of matched asset classes will allow you the build the Donut Chart 🍩.
Performance vs. Benchmark Chart
To build a beautiful chart, we'll need two time series, one from the portfolio's Time Weighted Return (TWR) and one from the desired Benchmark.
First, we'll perform a request to get our portfolio's TWR accumulated daily time series. From the retrieved time series, we can check the first date (representing the portfolio's first position) and use it to perform a request to the benchmark endpoint.
With both series in hand, you can now choose your favorite charting library to plot the comparative chat.
Positions List
The final component consists of a list of all our positions and their basic information, including their P&L and current market value.
We already have the market value from the Asset Class component. Now it's just a matter of requesting the P&L from its endpoint.
Matching the two lists for securityId and broker will provide you with all you need to build the list component.
🏁 Wrap-up
We've explored how to quickly build an investment app with GorilaCORE, but you can do much more! There's an immense amount of possibilities that derive from combining different endpoints. You can allow your customer to select time intervals, show them the impact of corporate actions from their owned stocks, build interactive tables and comparative charts, and the list goes on.
Contact us if you have any doubts about how to get started.